3D graphics
3d graphical primitives which build on Matplotlib plot_wireframe and plot_surface.
- plot_cone(radius, height, resolution=50, flip=False, centre=(0, 0, 0), ends=False, pose=None, ax=None, filled=False, **kwargs)[source]
Plot a cone using matplotlib
- Parameters:
radius (
float) – radius of cone at open endheight (
float) – height of cone in the z-directionresolution (
Optional[int]) – number of points on circumferece, defaults to 50flip (
Optional[bool]) – cone faces upward, defaults to Falseends (
Optional[bool]) – add a surface for the base of the conepose (
Optional[ndarray[Tuple[ResizeEventType[4],ResizeEventType[4]],dtype[floating]]]) – pose of cone, defaults to Noneax (
Optional[Axes]) – axes to draw into, defaults to Nonefilled (
Optional[bool]) – draw filled polygon, else wireframe, defaults to Falsekwargs – arguments passed to
plot_wireframeorplot_surface
- Returns:
matplotlib objects
- Return type:
List[Artist]
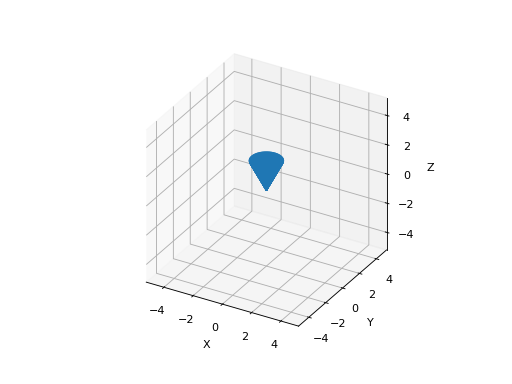
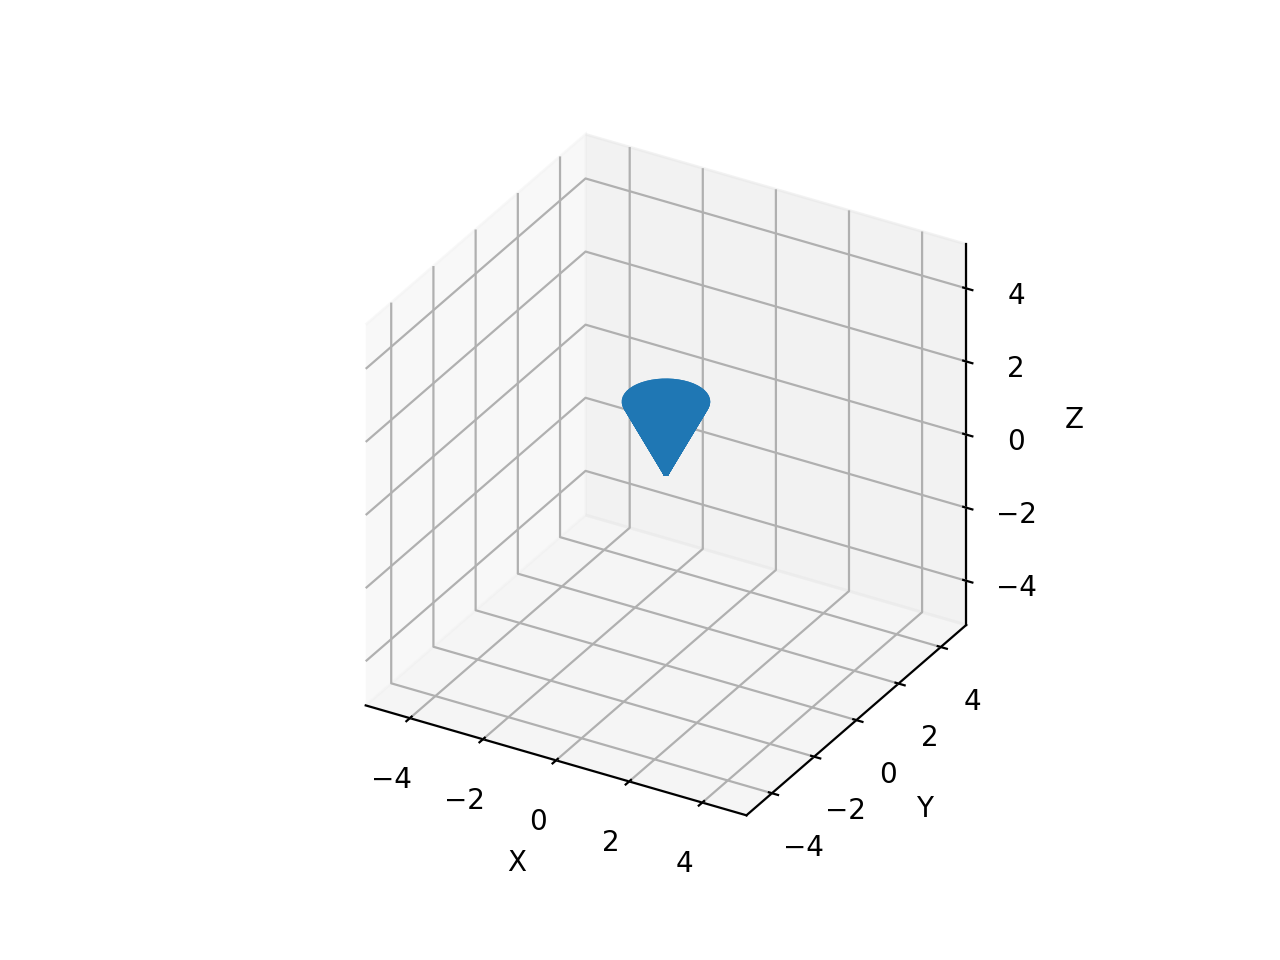
The axis of the cone is parallel to the z-axis and it is drawn pointing down. The point is at z=0 and the open end at z=
height. Ifflipis True then the cone faces upwards, the point is at z=heightand the open end at z=0.The cylinder can be positioned by setting
centre, or positioned and orientated by settingpose.Example:
>>> plot_cone(radius=1, height=2)
(
Source code,png,hires.png,pdf)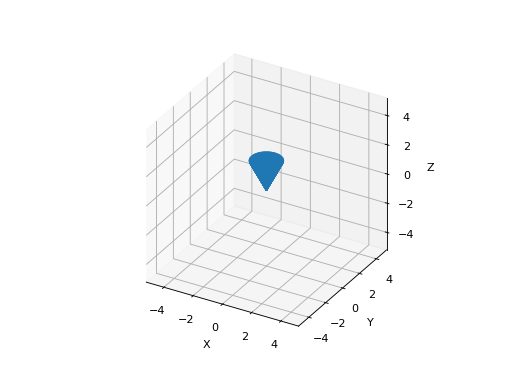
- Seealso:
plot_surface(),plot_wireframe()
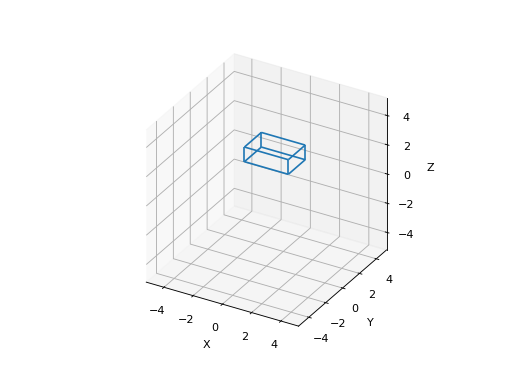
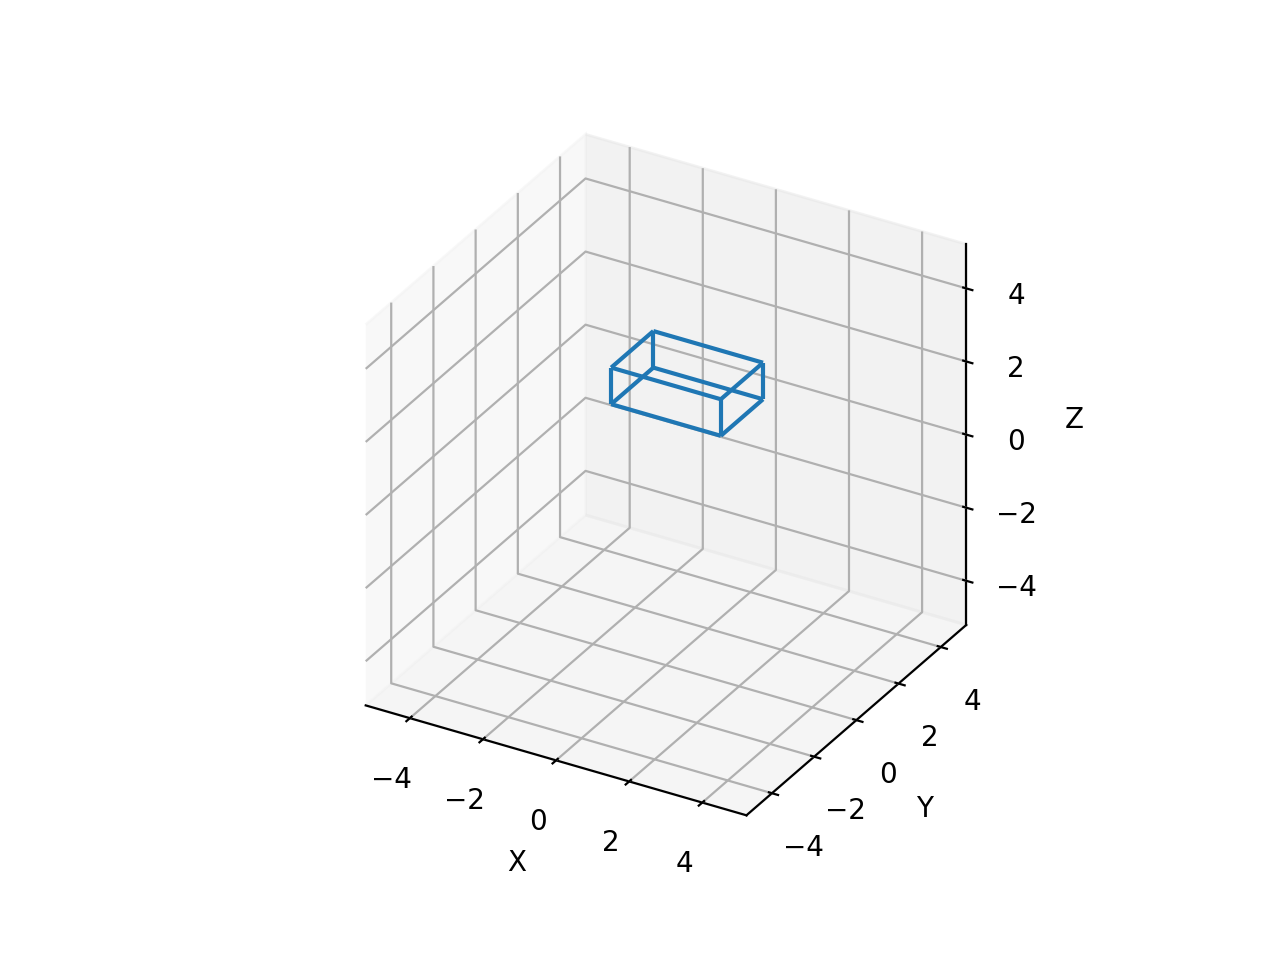
- plot_cuboid(sides=(1, 1, 1), centre=(0, 0, 0), pose=None, ax=None, filled=False, **kwargs)[source]
Plot a cuboid (3D box) using matplotlib
- Parameters:
sides (
Union[List[float],Tuple[float,float,float],ndarray[Tuple[ResizeEventType[3]],dtype[floating]]]) – side lengths, defaults to 1centre (
Union[List[float],Tuple[float,float,float],ndarray[Tuple[ResizeEventType[3]],dtype[floating]],None]) – centre of box, defaults to (0, 0, 0)pose (
Optional[ndarray[Tuple[ResizeEventType[4],ResizeEventType[4]],dtype[floating]]]) – pose of sphere, defaults to Noneax (
Optional[Axes]) – axes to draw into, defaults to Nonefilled (
Optional[bool]) – draw filled polygon, else wireframe, defaults to Falsekwargs – arguments passed to
plot_wireframeorplot_surface
- Returns:
matplotlib collection
- Return type:
List[Artist]
Example:
>>> plot_cone(radius=1, height=2)
(
Source code,png,hires.png,pdf)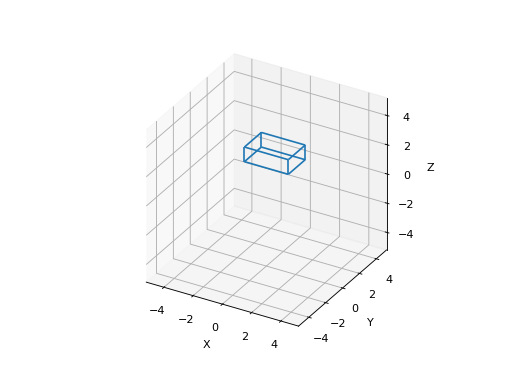
- Seealso:
plot_surface(),plot_wireframe()
- plot_cylinder(radius, height, resolution=50, centre=(0, 0, 0), ends=False, pose=None, ax=None, filled=False, **kwargs)[source]
Plot a cylinder using matplotlib
- Parameters:
radius (
float) – radius of cylinderheight (
Union[float,List[float],Tuple[float,float],ndarray[Tuple[ResizeEventType[2]],dtype[floating]]]) – height of cylinder in the z-directionresolution (
Optional[int]) – number of points on circumference, defaults to 50centre (
Union[List[float],Tuple[float,float,float],ndarray[Tuple[ResizeEventType[3]],dtype[floating]],None]) – position of centrepose (
Optional[ndarray[Tuple[ResizeEventType[4],ResizeEventType[4]],dtype[floating]]]) – pose of cylinder, defaults to Noneax (Axes3D, optional) – axes to draw into, defaults to None
filled (bool, optional) – draw filled polygon, else wireframe, defaults to False
kwargs – arguments passed to
plot_wireframeorplot_surface
- Returns:
matplotlib objects
- Return type:
List[Artist]
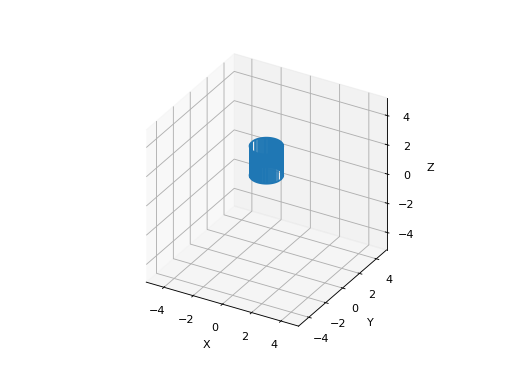
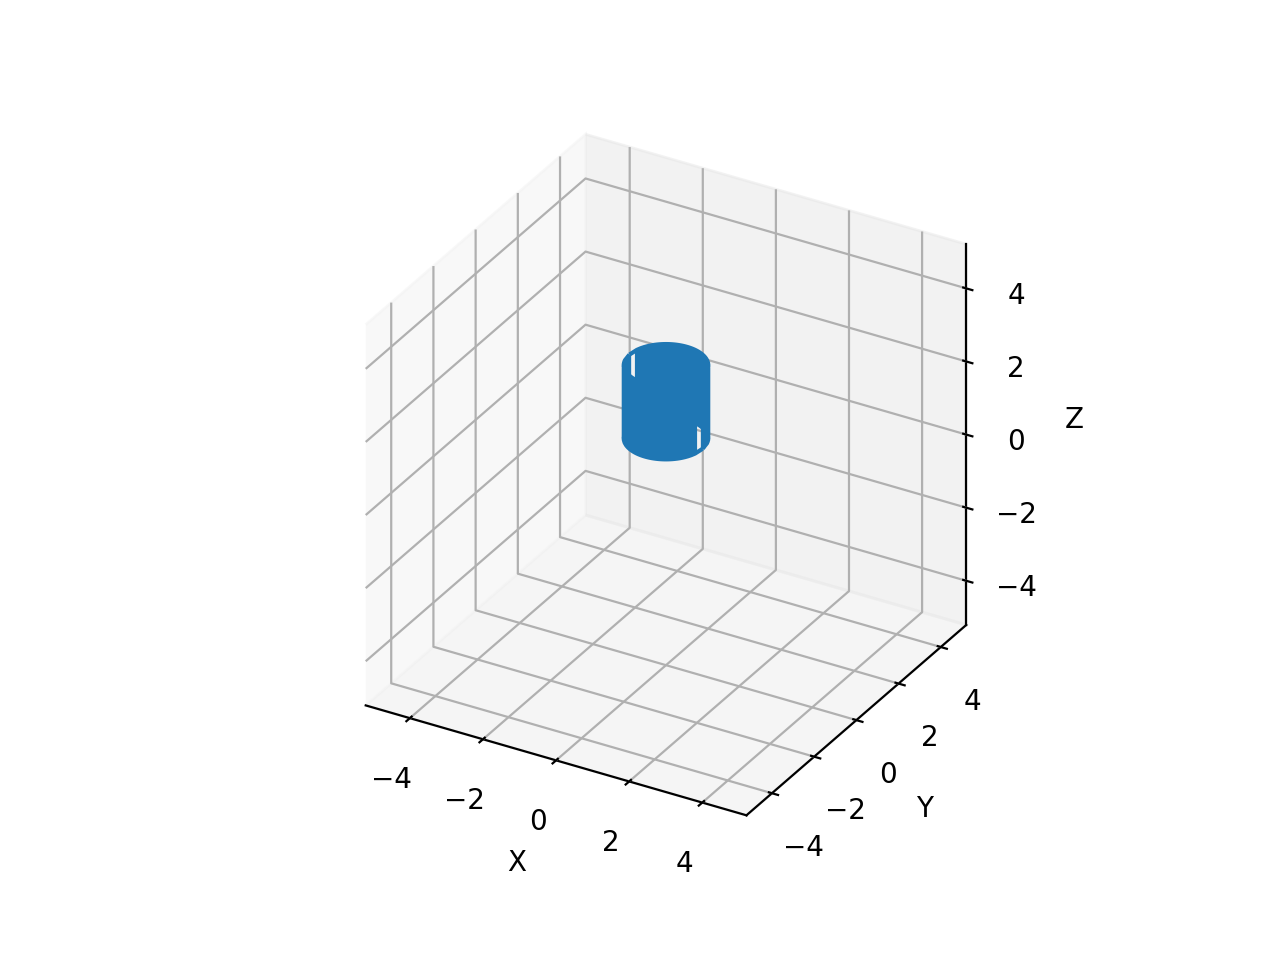
The axis of the cylinder is parallel to the z-axis and extends from z=0 to z=height, or z=height[0] to z=height[1].
The cylinder can be positioned by setting
centre, or positioned and orientated by settingpose.Example:
>>> plot_cylinder(radius=1, height=(1,3))
(
Source code,png,hires.png,pdf)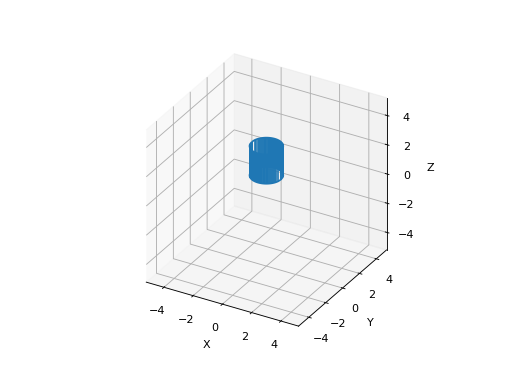
- Seealso:
plot_surface(),plot_wireframe()
- plot_ellipsoid(E, centre=(0, 0, 0), scale=1, confidence=None, resolution=40, inverted=False, ax=None, **kwargs)[source]
Draw an ellipsoid using matplotlib
- Parameters:
E (
ndarray[Tuple[ResizeEventType[3],ResizeEventType[3]],dtype[floating]]) – ellipsoidcentre (
Union[List[float],Tuple[float,float,float],ndarray[Tuple[ResizeEventType[3]],dtype[floating]],None]) – [description], defaults to (0,0,0)scale (
Optional[float])confidence (
Optional[float]) – confidence interval, range 0 to 1resolution (
Optional[int]) – number of points on circumferece, defaults to 40inverted (
Optional[bool]) – \(E^{-1}\) rather than \(E\) provided, defaults to Falseax (
Optional[Axes]) – [description], defaults to Nonewireframe (bool, optional) – [description], defaults to False
stride (int, optional) – [description], defaults to 1
- Return type:
List[Artist]
plot_ellipsoid(E)draws the ellipsoid defined by \(x^T \mat{E} x = 0\) on the current plot.Example:
>>> plot_ellipsoid(np.diag([1, 2, 3]), [1, 1, 0], color="r", resolution=10); # draw red ellipsoid
(
Source code,png,hires.png,pdf)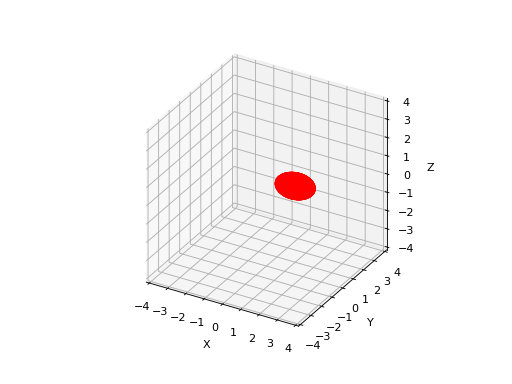
Note
If a confidence interval is given then
Eis interpretted as a covariance matrix and the ellipse size is computed using an inverse chi-squared function.
- Seealso:
plot_surface(),plot_wireframe()
- plot_sphere(radius, centre=(0, 0, 0), pose=None, resolution=50, ax=None, **kwargs)[source]
Plot a sphere using matplotlib
- Parameters:
centre (
Union[List[float],Tuple[float,float,float],ndarray[Tuple[ResizeEventType[3]],dtype[floating]],None]) – centre of sphere, defaults to (0, 0, 0)radius (
float) – radius of sphere, defaults to 1resolution (
Optional[int]) – number of points on circumferece, defaults to 50pose (
Optional[ndarray[Tuple[ResizeEventType[4],ResizeEventType[4]],dtype[floating]]]) – pose of sphere, defaults to Noneax (
Optional[Axes]) – axes to draw into, defaults to Nonefilled (bool, optional) – draw filled polygon, else wireframe, defaults to False
kwargs – arguments passed to
plot_wireframeorplot_surface
- Returns:
matplotlib collection
- Return type:
List[Artist]
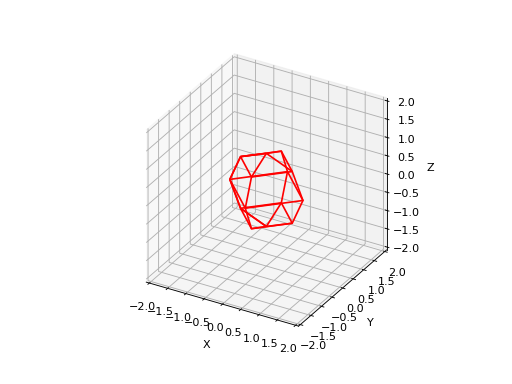
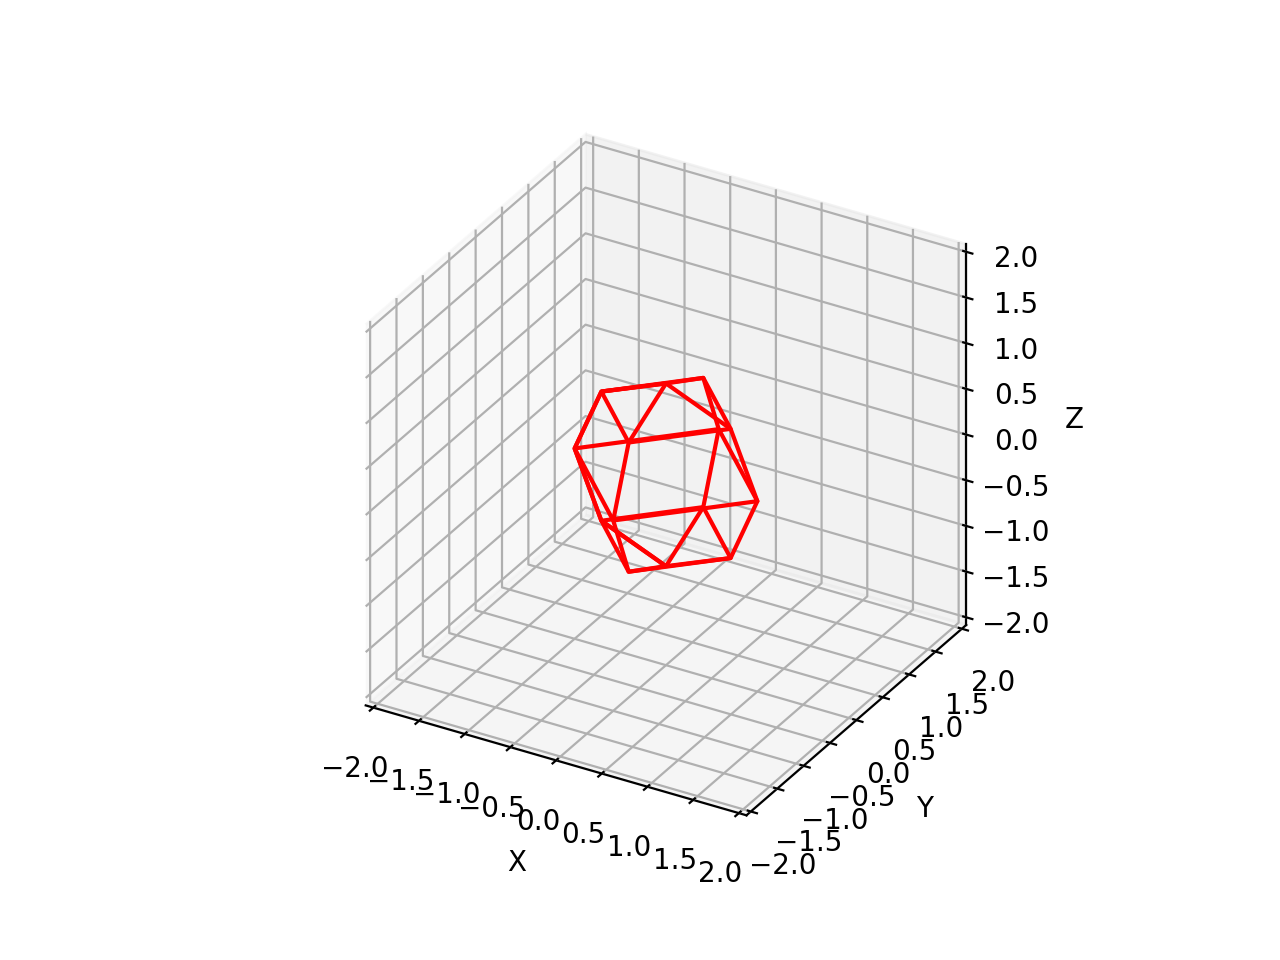
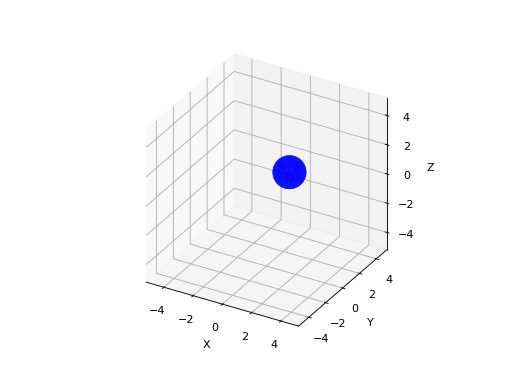
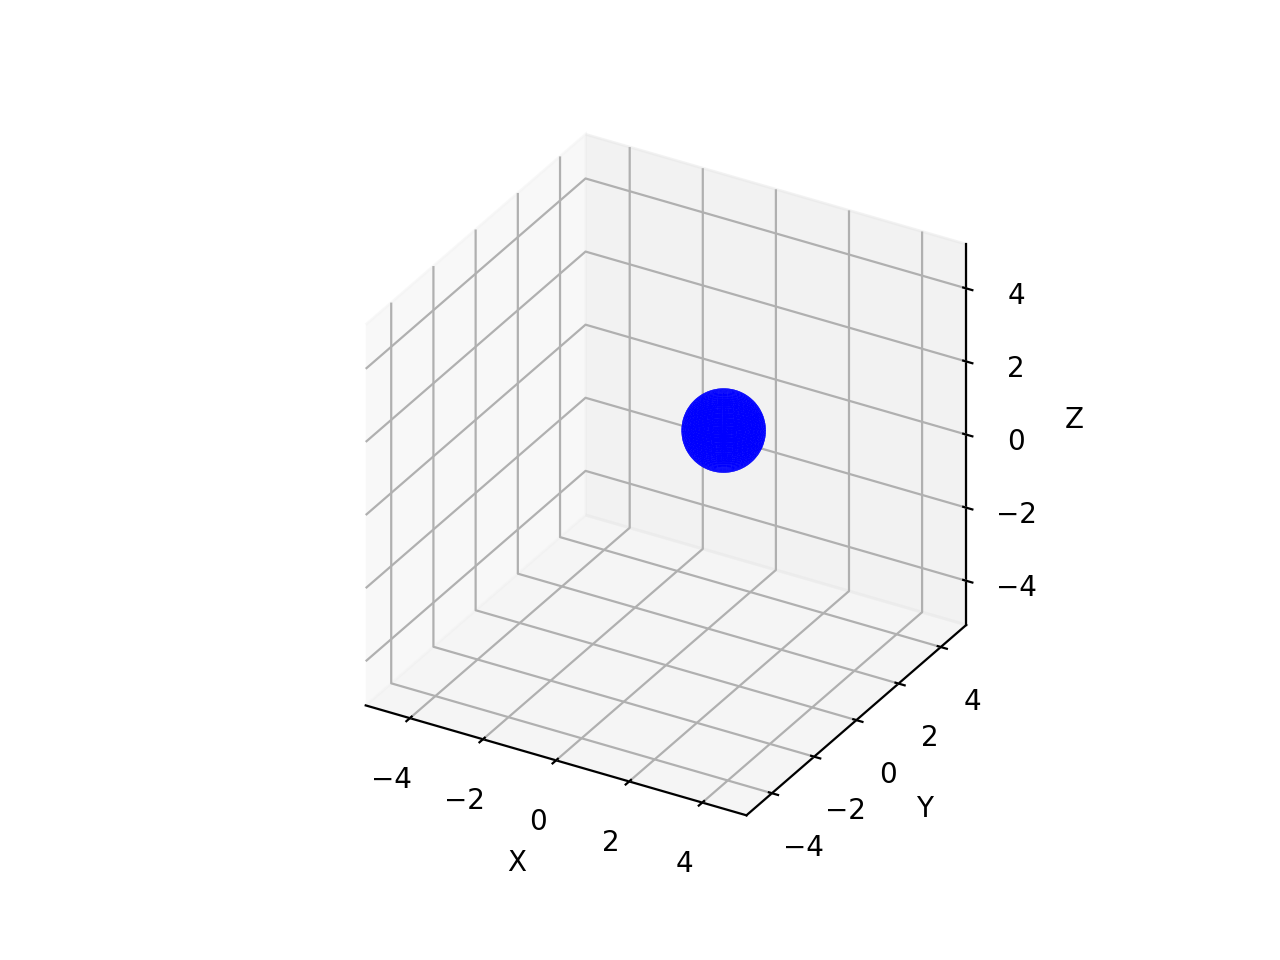
Plot one or more spheres. If
centreis a 3xN array, then each column is taken as the centre of a sphere. All spheres have the same radius, color etc.Example:
>>> from spatialmath.base import plot_sphere
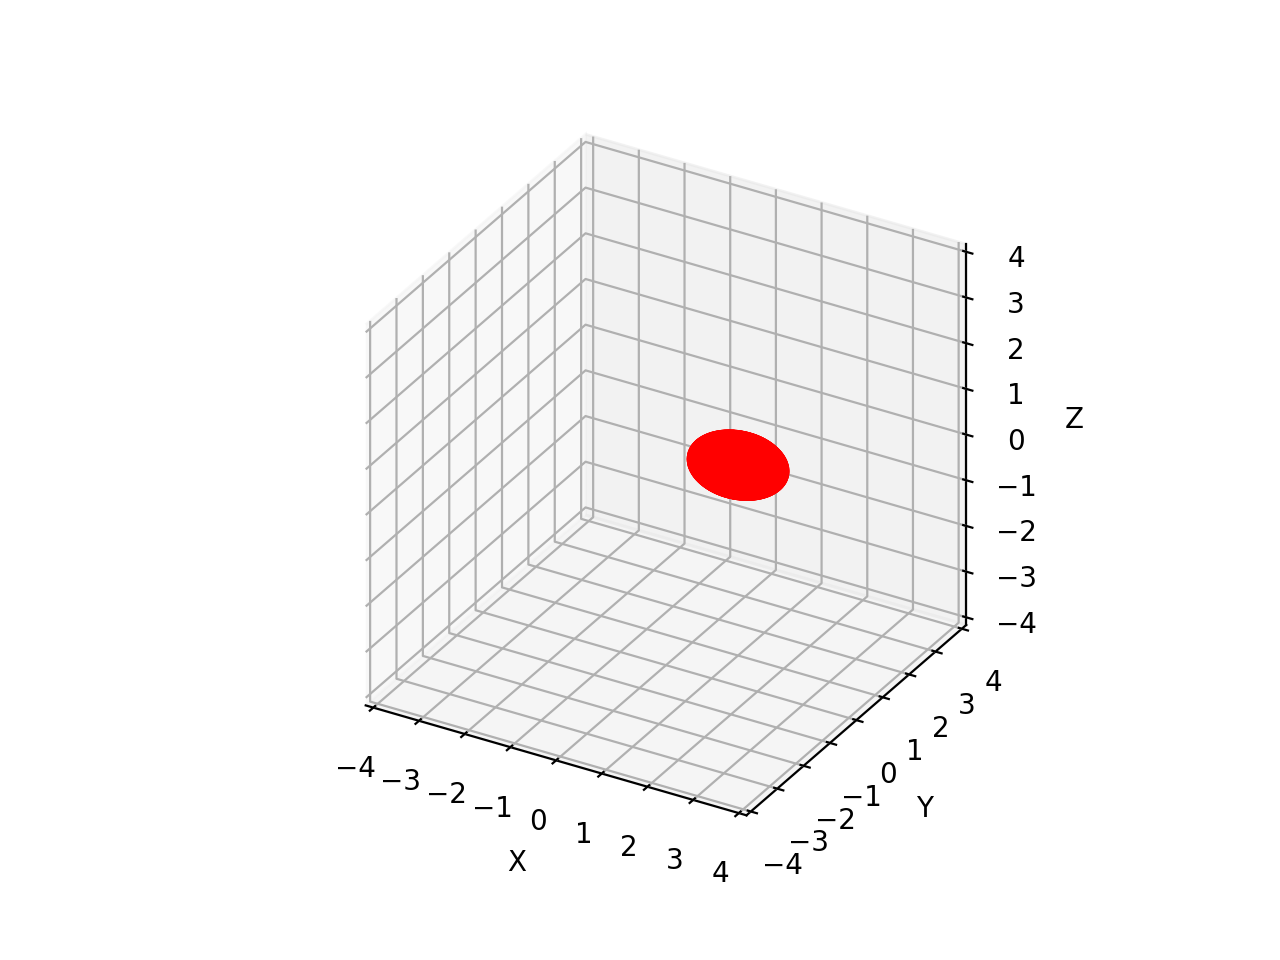
>>> plot_sphere(radius=1, color="r", resolution=10)   # red sphere wireframe
>>> plot_sphere(radius=1, centre=(1,1,1), filled=True, facecolor='b')
(
Source code,png,hires.png,pdf)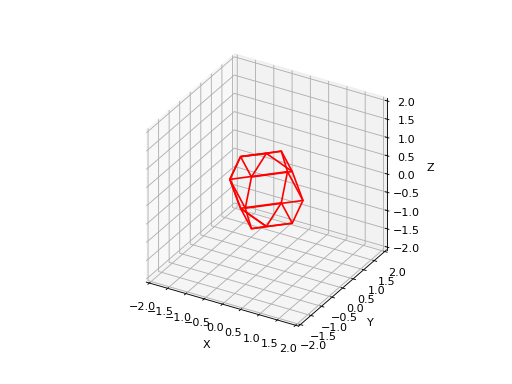
(
Source code,png,hires.png,pdf)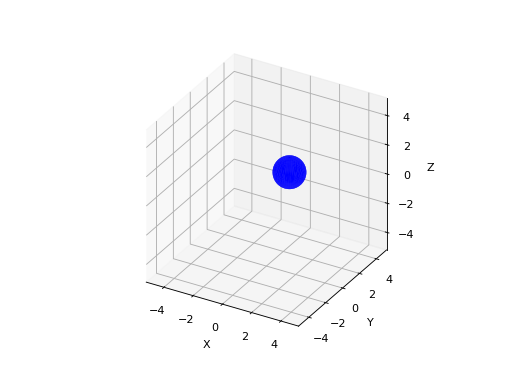
- Seealso:
plot_surface(),plot_wireframe()
- plotvol3(dim=None, ax=None, equal=True, grid=False, labels=True, projection='ortho', new=False)[source]
Create 3D plot volume
- Parameters:
ax (
Optional[Axes]) – axes of initializer, defaults to new subplotequal (
Optional[bool]) – set aspect ratio to 1:1:1, default False
- Returns:
initialized axes
- Return type:
Initialize axes with dimensions given by
dimwhich can be:input
xrange
yrange
zrange
A (scalar)
-A:A
-A:A
-A:A
[A, B]
A:B
A:B
A:B
[A, B, C, D, E, F]
A:B
C:D
E:F
- Seealso:
plotvol2(),expand_dims()